The easiest and quickest way to know if you are burning through cash without return is simple: check real-time benchmarks.
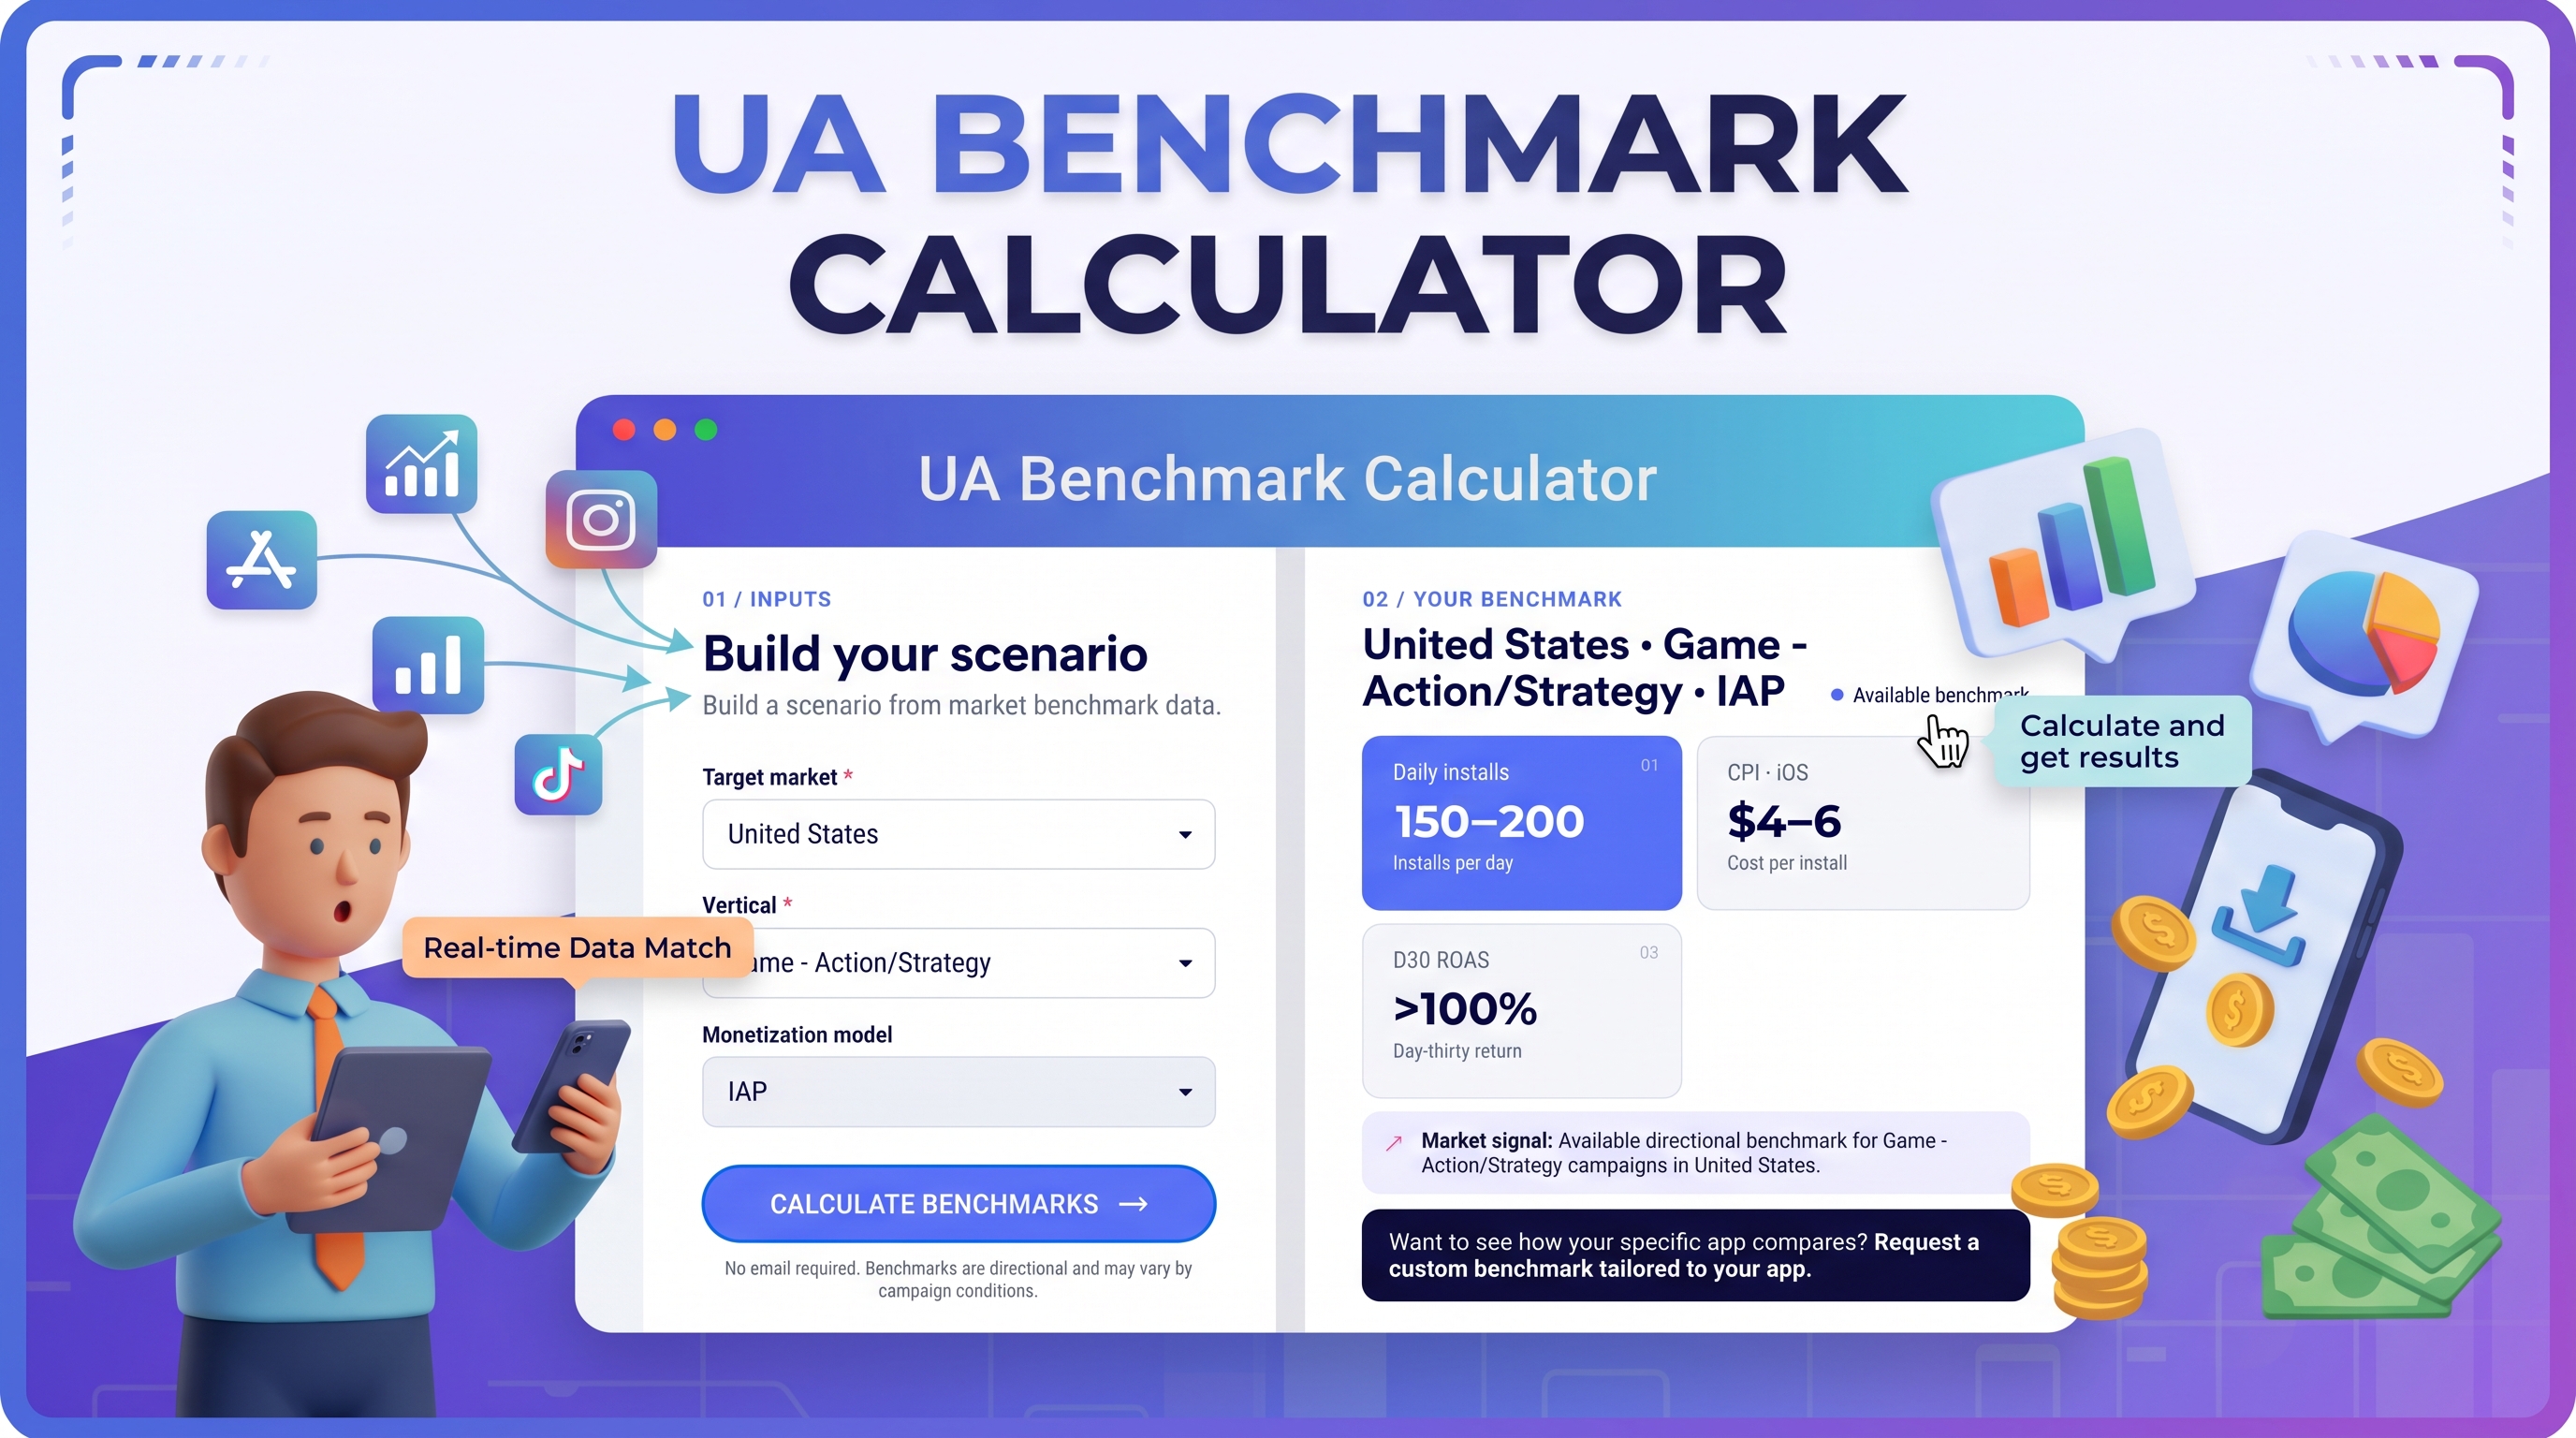
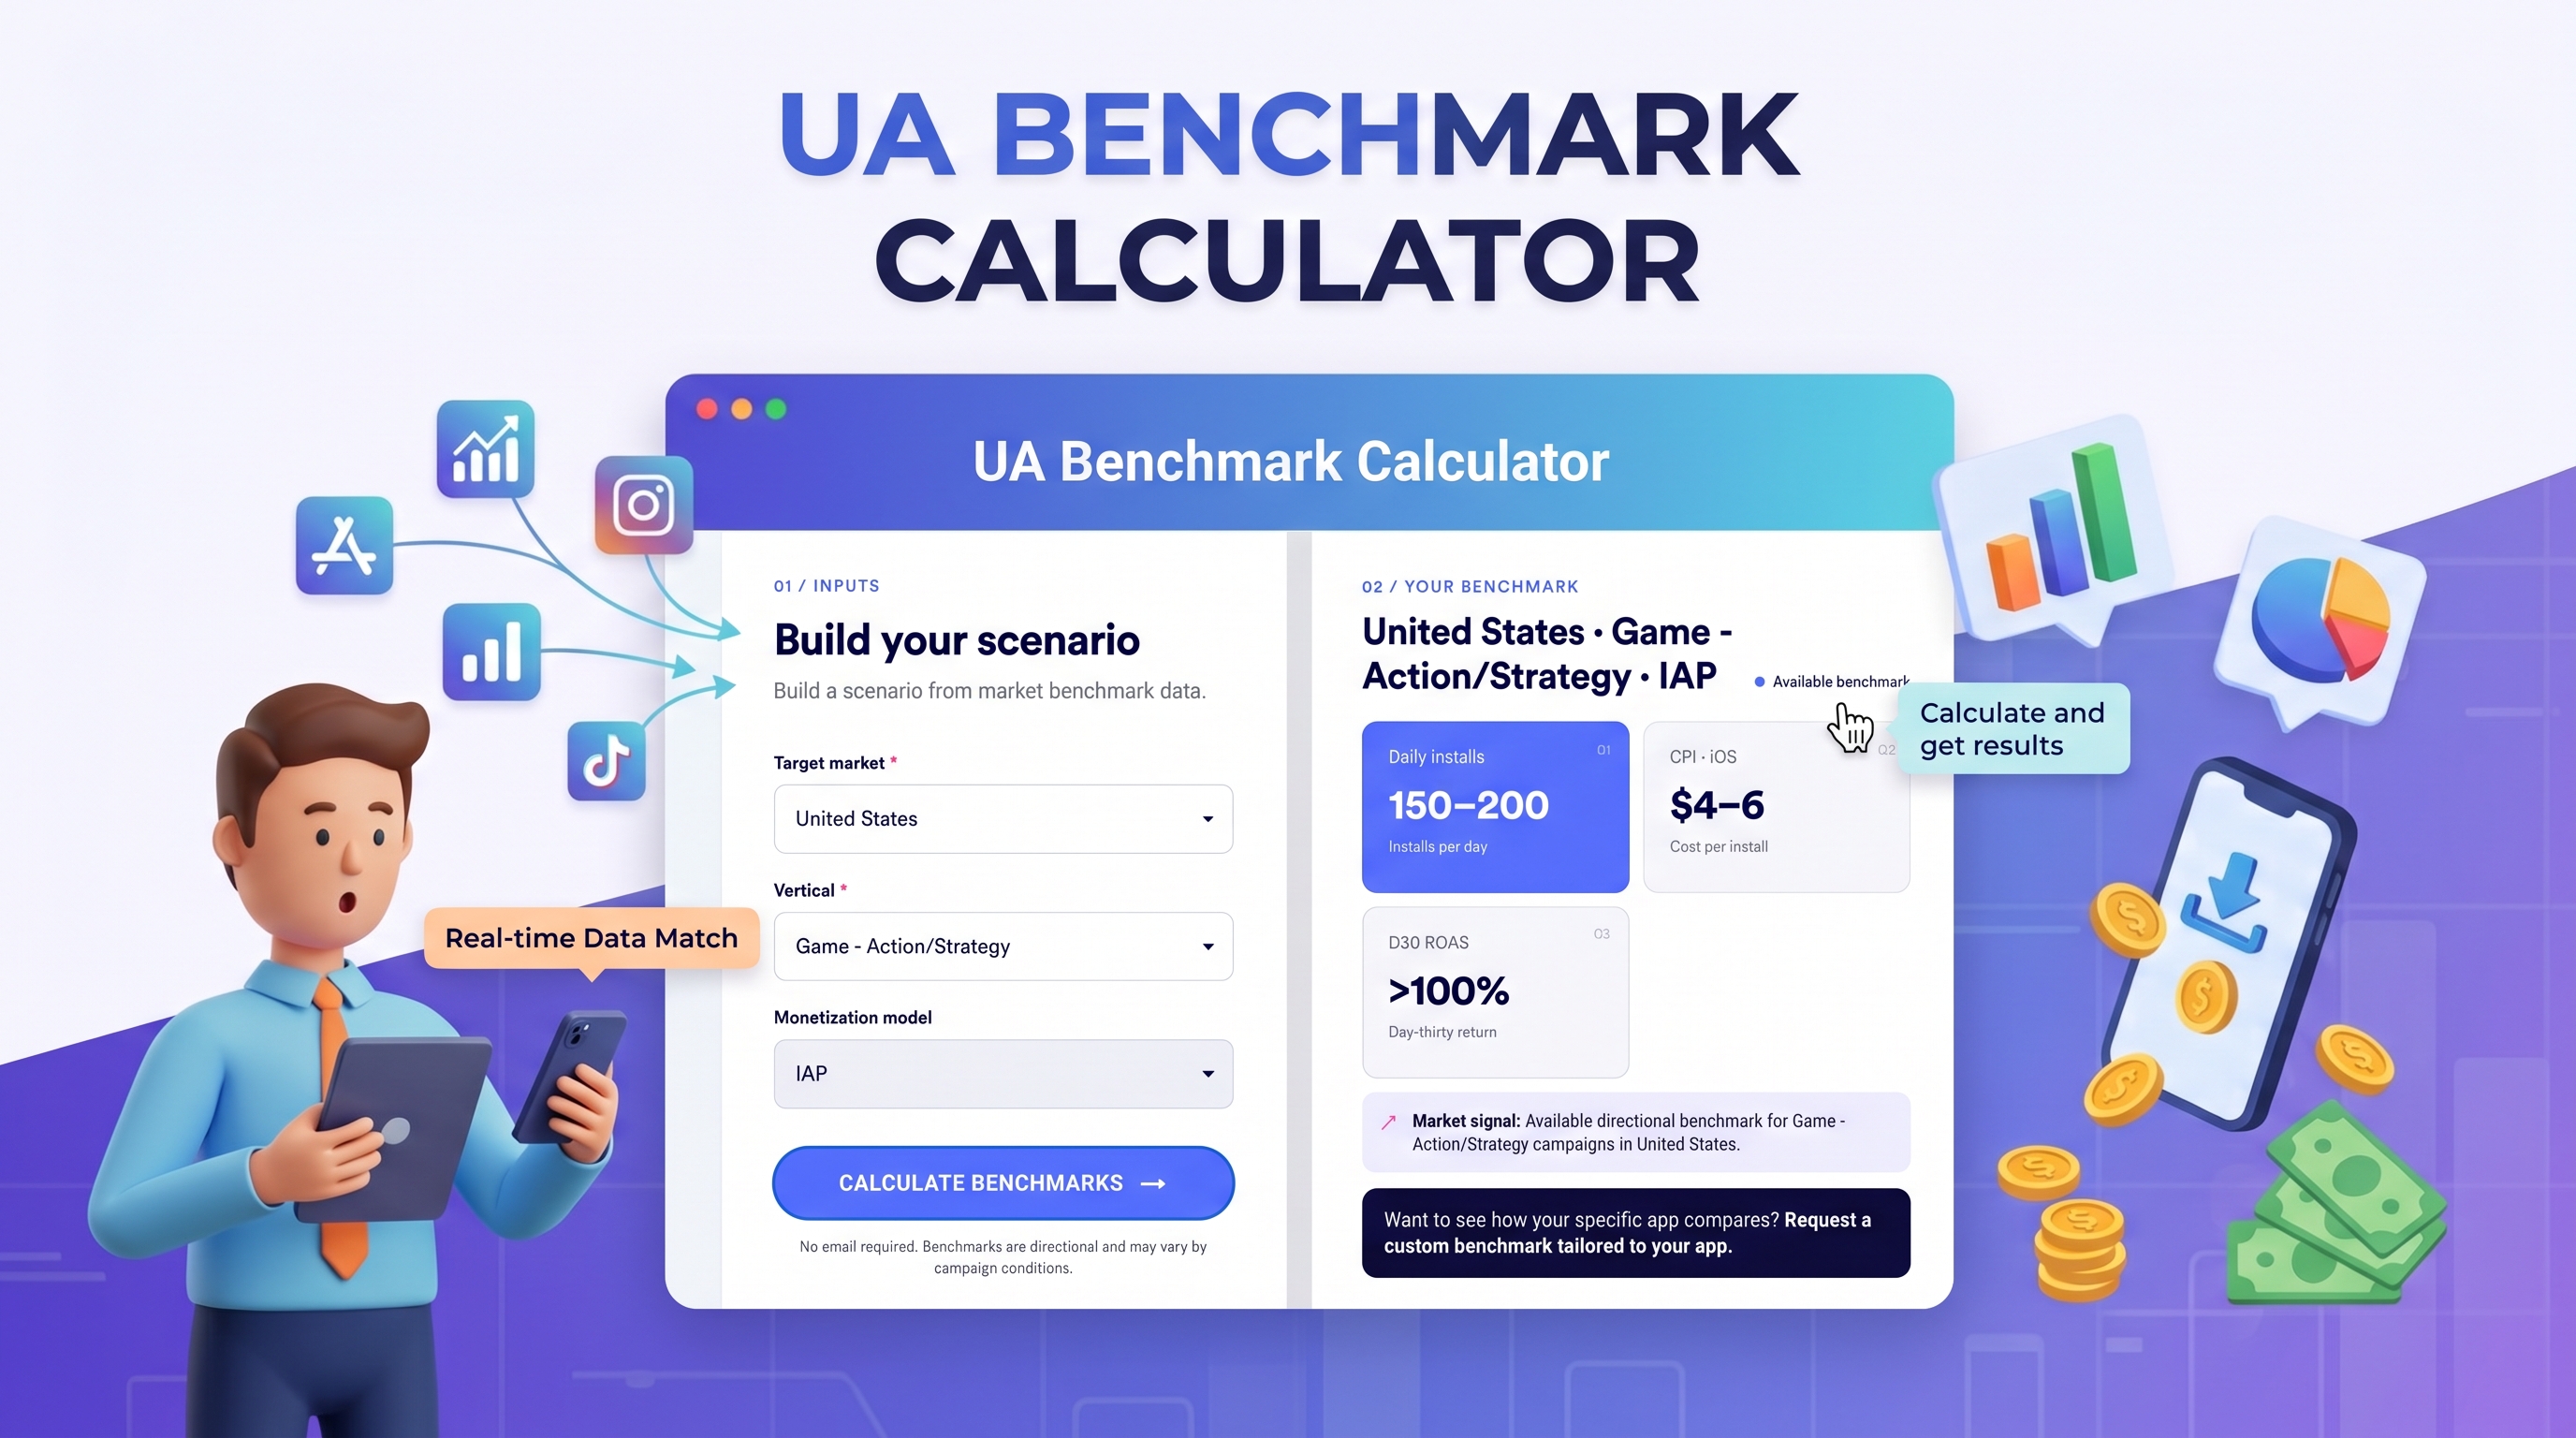
Want to see where your campaigns stand right now? Check out the Mapendo UA Benchmark Calculator and see where your numbers stand against live market data.
Why is Protecting Your UA Budget Harder Than It Looks?
Every growth marketer wrestles with the fear of burning ad spend. Protecting your UA budget in the mobile space is uniquely difficult because the ecosystem is opaque and fiercely competitive.
UA costs vary drastically depending on the channel, pricing model, and market. Walled gardens like Google and Meta operate with proprietary algorithms, while programmatic platforms, rewarded networks, and emerging channels like CTV each follow completely different auction dynamics. Some charge on a CPM basis, while others allow you to optimize towards a post-install event or CPI.
On top of that, your numbers will look different depending on your app vertical and the countries you target–acquiring an e-commerce user in the US simply doesn’t cost the same as in Latin America.
Crucially, while CPI may offer the most straightforward snapshot of campaign performance, it does not tell the whole story–a low Cost Per Install (CPI) does not equal high effectiveness, and a higher CPI is not necessarily a waste of your user acquisition budget.
In reality, CPI varies significantly depending on the app category and monetization model. For example, a $0.30 CPI makes total sense for hyper-casual games: they monetize almost entirely through in-game ads, deal with fast user turnover, and rely on massive volumes of new downloads to stay profitable. On the other hand, categories like fintech and e-commerce make money when users actually spend inside the app.
Because they need high-quality users who stick around for the long run and make repeat purchases, paying a $10-$15 CPI can be completely justified—and still deliver the target ROAS for your UA budget. To know if you’re really wasting money, you have to look beyond cheap downloads and evaluate whether your acquisition costs match how your app actually makes money.
What Does “Wasting Your UA Budget” Actually Mean?
At its core, wasting your UA budget comes down to diminishing returns: you increase ad spend by 50% but your active users don’t budge, post-install engagement stays low, and revenue doesn’t grow. In short, you are simply paying more to acquire the same or lower-quality users.
The primary factor behind this waste is scaling on channels that lack real scalability or optimization technology. Giants like Meta and Google offer sophisticated targeting, but they are expensive and can quickly oversaturate your audience. On the other hand, affiliate networks often lack advanced technology needed to acquire high-quality users at scale. Because they rely entirely on third-party affiliate channels without proprietary optimization algorithms, they have little control over delivery. As a result, increasing your User Acquisition Budget there doesn’t drive real business growth–it just buys impressions served to irrelevant audiences or traffic that never converts.

Where Can You Find the Right Benchmarks for Your UA Budget?
To diagnose whether your UA budget is performing as it should, marketers typically turn to a few common sources:
- Industry Reports: Annual or quarterly market overviews published by analytics platforms, such as Sensor Tower or Business of Apps.
- MMP Resources: Official benchmark libraries, guides, and performance indices hosted directly by Mobile Measurement Partners like AppsFlyer, Adjust and Singular.
- Peer Communities and Historical Internal Data: Slack growth communities, developer forums, and historical company performance data.
The catch? Most industry reports are updated too slowly to safeguard an active UA budget. They rely on data that is 6 to 12 months old, which completely misses recent price jumps in ad auctions. On top of that, broad averages rarely match your specific reality. Comparing a niche utility app in Germany or France against a global 'All Apps' report gives you numbers that just aren't helpful for your day-to-day decisions.
The Smarter Fix: Mapendo UA Benchmark Calculator
Instead of guessing or relying on outdated PDFs to verify your UA budget, the most direct solution is using a dedicated tool like the Mapendo UA Benchmark Calculator.
By matching your live campaigns against real-time data from your specific app category, it tells you immediately whether your CPIs and conversion rates are healthy or way too high. Instead of waiting weeks to realize you paid for users who never convert, you can check your numbers in seconds and shift your budget to channels that actually drive growth.