What is the average CPI in 2026
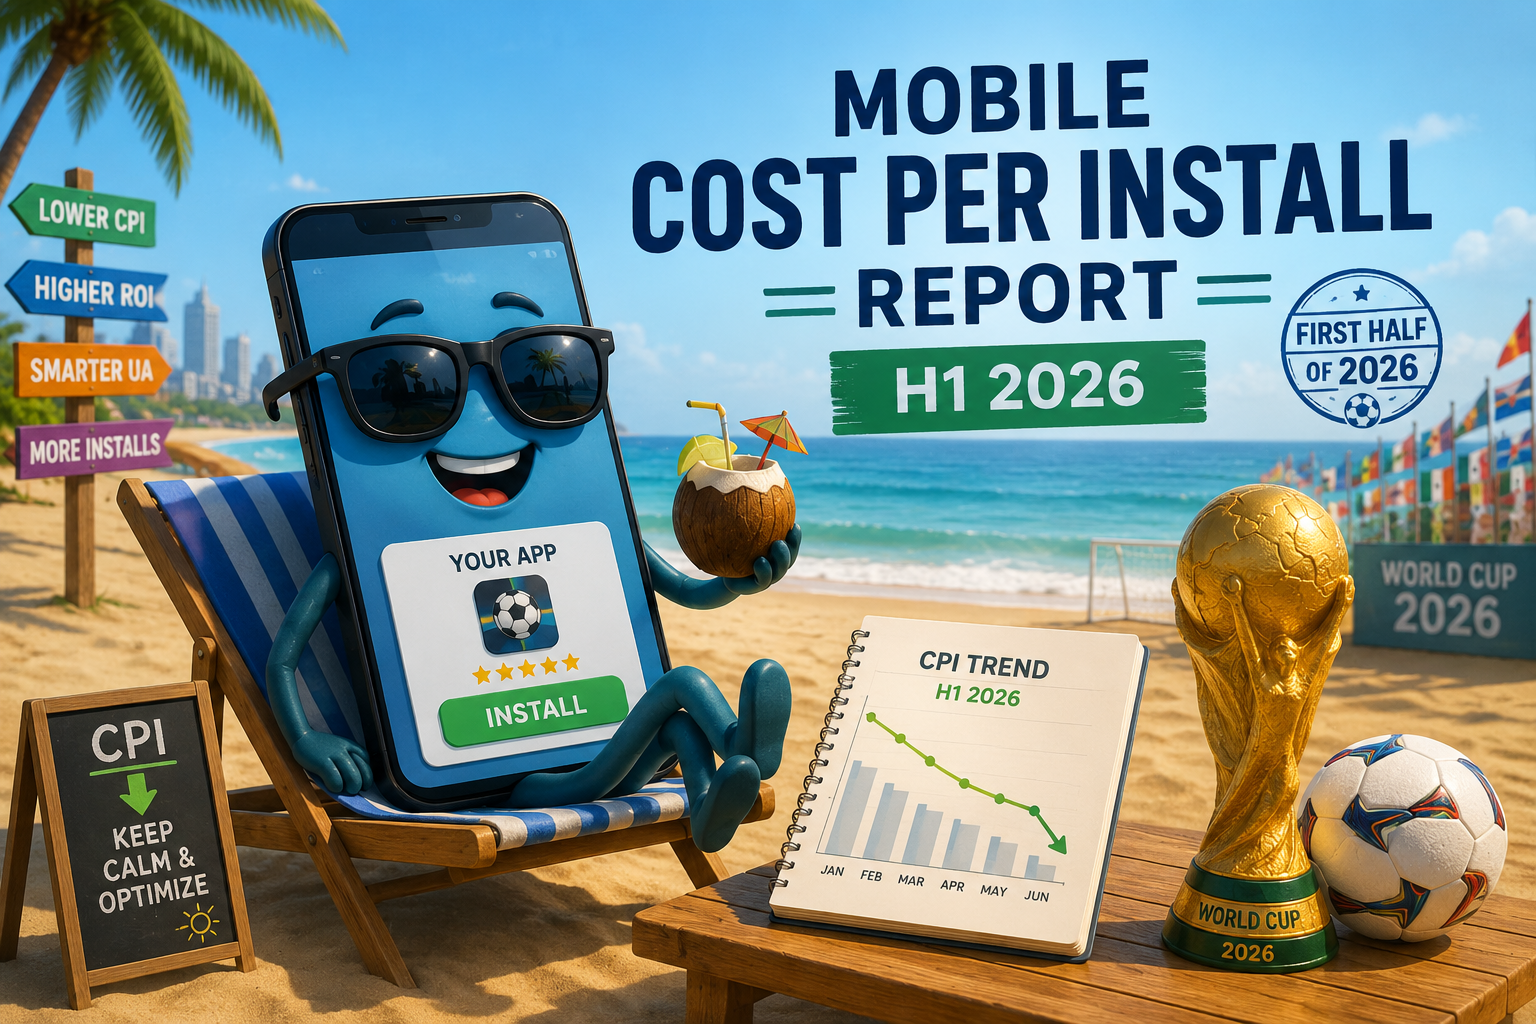
The first half of 2026 has now gone, and it’s time to take a look at the current status of the mobile advertising industry, especially at one of its key metrics: CPI. We have just completed our latest industry report, highlighting CPI benchmarks & trends in 2026. across app categories like gaming, finance, shopping, entertainment, etc.
Download the complete report here for free!
Cost per install, computed as the ratio between the ad spend and the number of new users acquired, measures the cost of acquiring a new single user. While it might seem less relevant than advanced metrics like ROAS, advertisers still see it as a key benchmark for their UA.
Overall, CPI has slightly increased, but a single value is meaningless for app marketers, because CPI significantly changes based on several dimensions like platform, country, app category, creative, etc. Therefore, let’s break it down into such dimensions.
iOS vs Android CPI: what’s the gap in 2026 first half
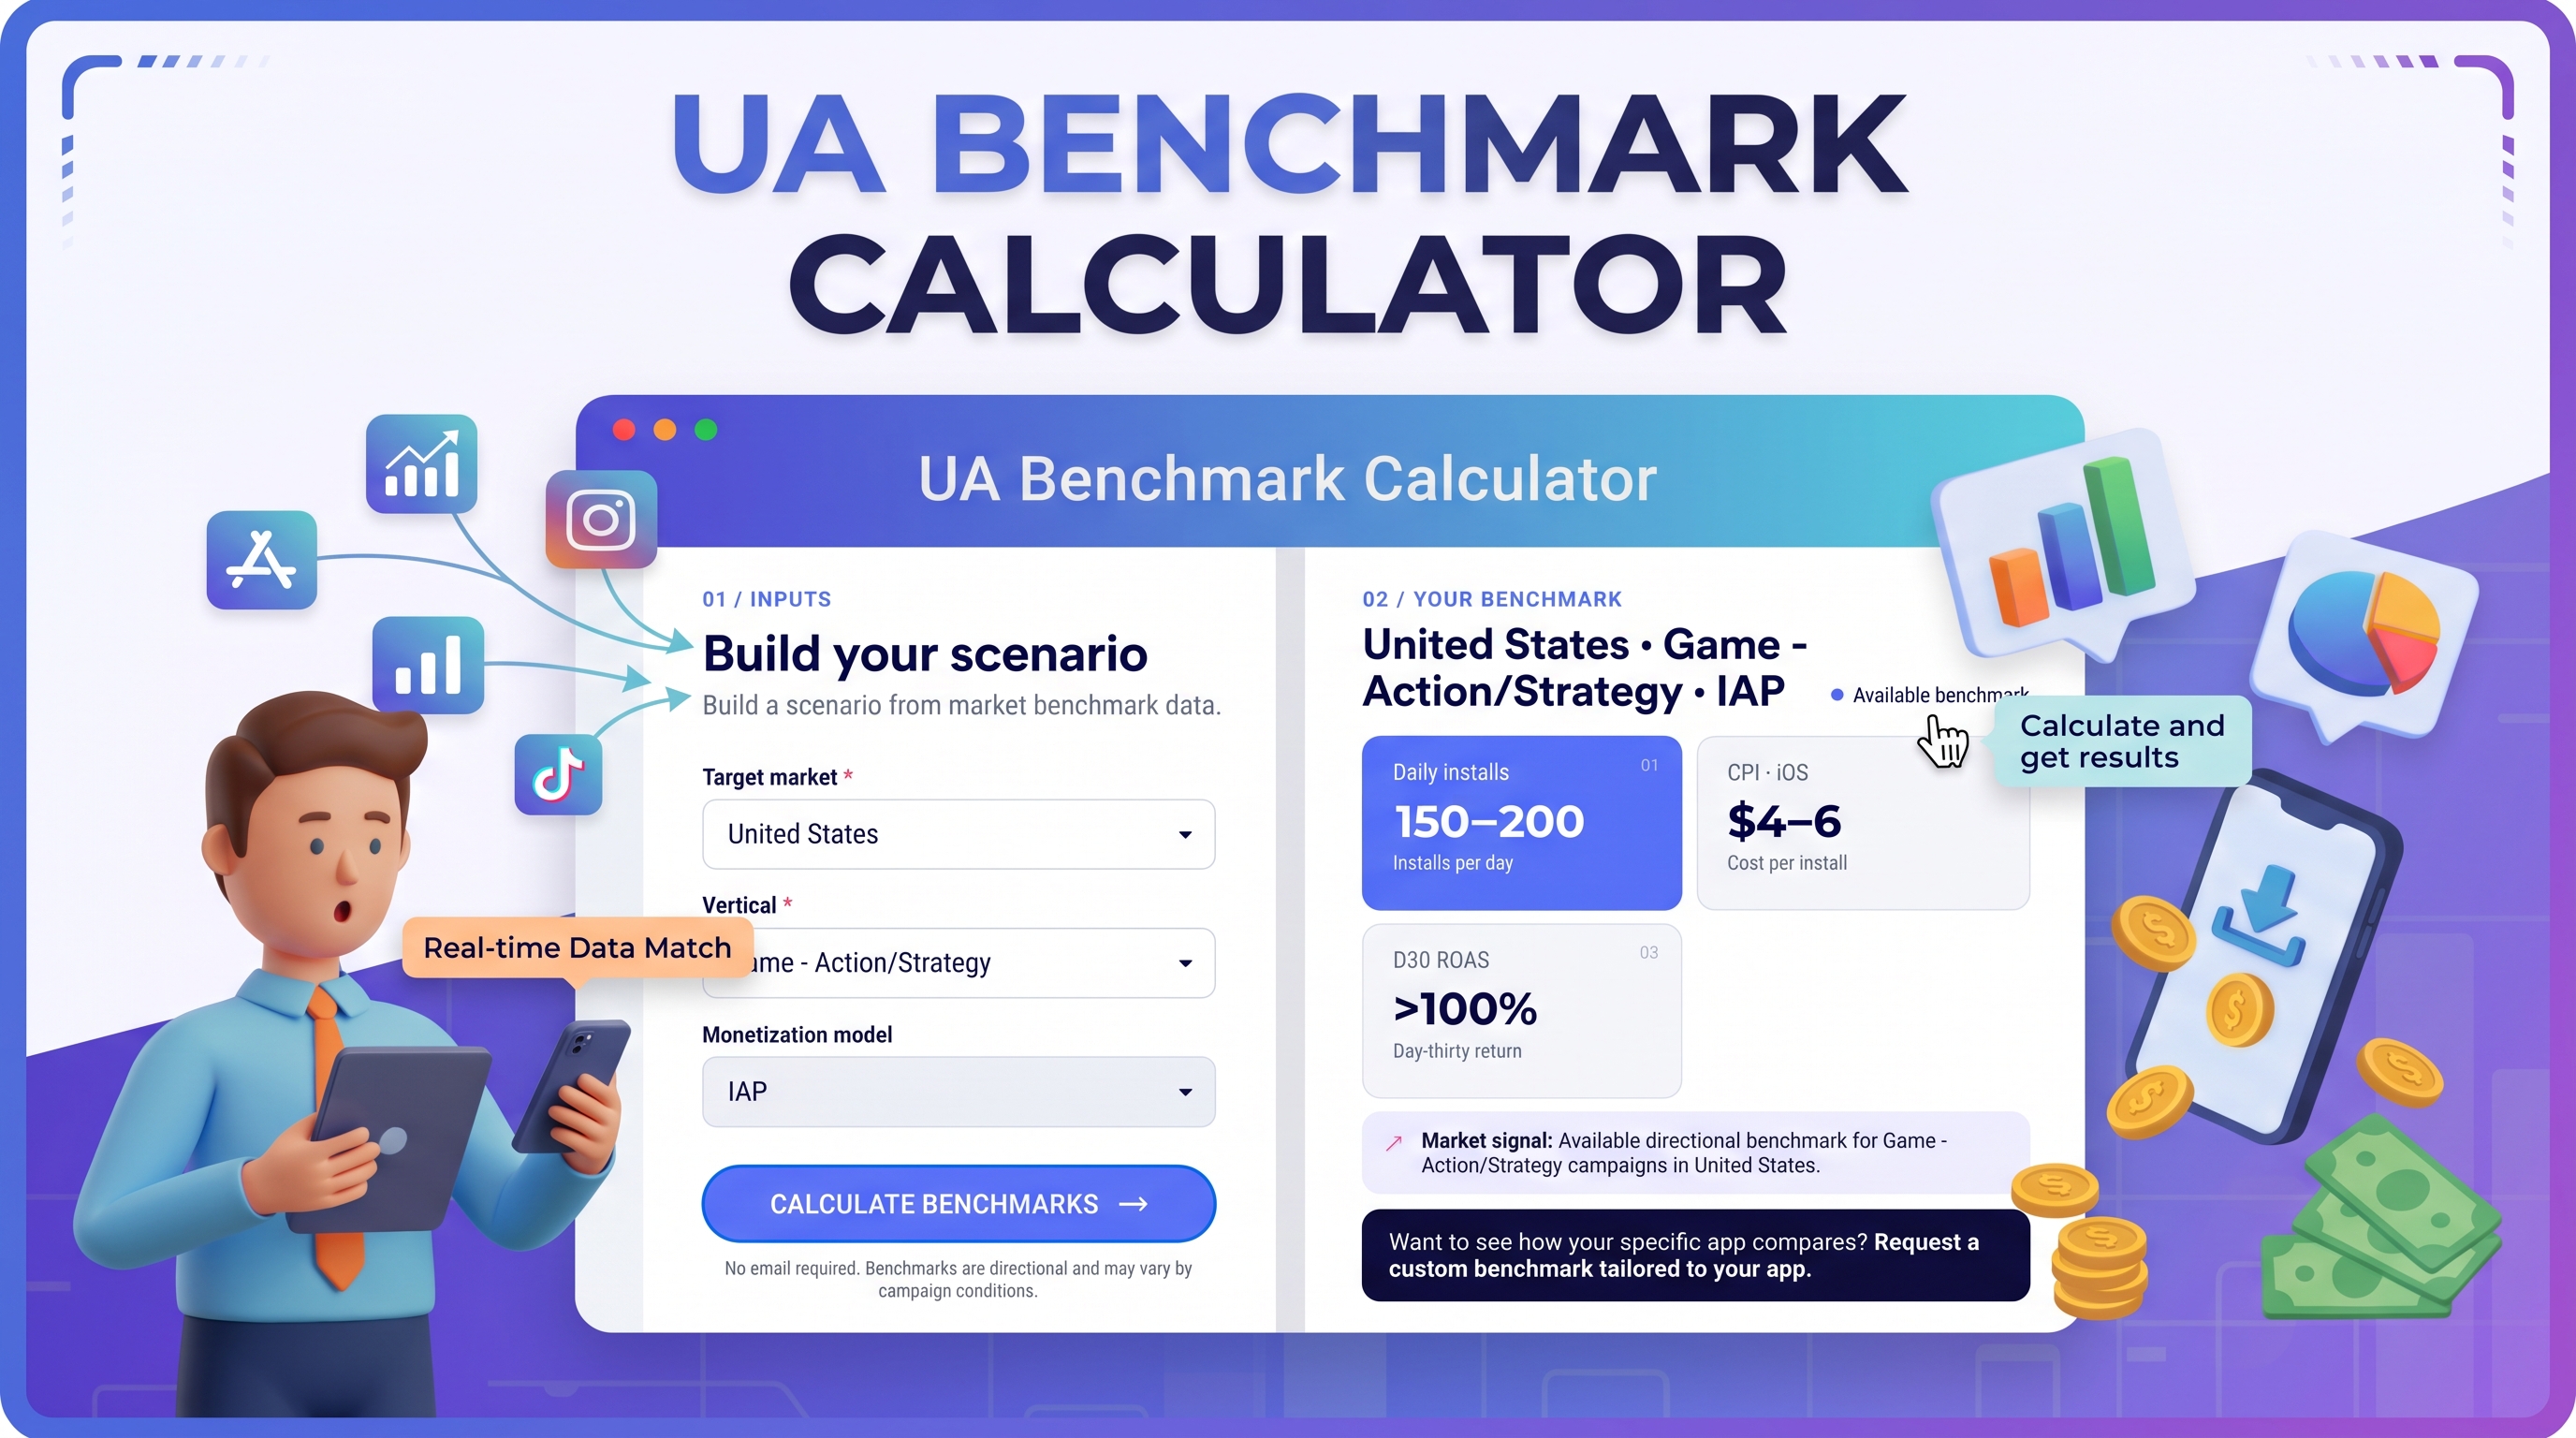
The new year hasn’t shortened the gap between iOS and Android, which still remains quite sharp. While iOS CPIs range from $4 to 6$ on average, Android CPIs rarely are above $3-3.50. The gap is due to both Apple’s strict privacy regulations, which makes targeting more difficult, and the supposed higher purchasing power, and thus LTV, of iOS users.
However, Android ad spend is increasing, compared to the previous year, signaling how advertisers are investing in android apps, in order to avoid the targeting challenges posed by iOS limitations.
As previously mentioned, such figures are very volatile, as they are affected by additional dimensions like app category and country.
CPI by app category
Verticals which rely on high-LTV users like fintech and Sports betting/casino apps show the highest CPIs across all categories. Since single users are supposed to spend a high amount of money on such apps, the cost of acquiring them is significantly higher than it is for different types of apps.
Mobile games show a very wide range of CPIs, depending on the subcategories and multiple game genres available in the market. Hyper-casual games, action/RPG, midcore and puzzle games all have different cost per install rates.
CPIs then slightly change across categories like shopping/e-commerce, dating/lifestyle and entertainment. Click on the picture below to download the report for free and unlock the full CPI by app category chart!
CPI by country
CPI rates change widely depending on countries, due to multiple factors such as purchasing power, competition and ad inventory. Instead of listing as many countries as possible and looking at minor differences, we segmented the countries in major tiers, clustering together countries with similar conditions.
- Tier 1 countries (US, Canada, UK, Australia) show the highest cost per install rates.
- Western european countries, Japan and South Korea represent tier 2 and immediately follow Tier 1 in terms of CPI rates.
- Tier 3 includes countries like Brazil, Mexico, Turkey and Malaysia, amongst others.
- Finally, tier 4 refers to India, South-East Asia and Africa.
In addition, within every country the gap between iOS and Android CPI might be different, due to the wider adoption of Android in multiple countries, especially Latam and South-East Asia.
Latest CPI macro-trends
Besides the dimensions already mentioned, like platform and country, there are additional macro-trends which affected the CPI rates in the first half of 2026. First of all, AI is re-shaping the mobile advertising industry, and many others actually. Creatives generated and optimized by AI mean cheaper costs, allowing advertisers to spend more on traffic acquisition and thus increasing CPI rates.
Secondly, the privacy-centric shift of the industry is increasing attribution challenges, making targeting capabilities more difficult to find and, as a result, more expensive. This is especially true for iOS, where Apple’s own attribution framework, SKAdNetwork, comes at a cost.
Last but not least, more and more advertisers are moving to a ROAS/CPA-based approach for their mobile user acquisition activities. This means CPI rates show unexpected fluctuations, difficult to predict and to justify. Since CPA significantly change based on the app category (CPA rates can amount to over $300 for trading and casino apps) their eCPI are a direct consequence of that and show very different rates.
How to lower your CPI
High CPI rates shouldn’t scare advertisers, as they reflect macro-trends and market shifts and changes. Moreover, advertisers and app marketers are increasingly focusing on revenue-related metrics like ROI and ROAS, directly comparing costs to the revenue they are generating.
However, there are a few strategies to lower CPIs when running user acquisition campaigns. For example, advertisers can look for platforms with sophisticated ML technology, able to increase conversion rates and to generate profits with low CPI rates. Alternatively, there are traffic channels like affiliate programs where advertisers can set their payouts and let networks and platforms apply to them.
Ultimately, cost per install rates depend on multiple factors and should be approached with an open and flexible mindset, focusing on post-install KPIs like retention rate and ROAS.
Final thoughts
The first half of 2026 has concluded with the start of the soccer World Cup, which is giving a great boost to all the players involved. CPI rates are following a positive trend across different app categories, especially those affected by the World Cup. The gap between iOS and Android is still here to stay, while the differences amongst countries tend to be in line with the past year.
Stop guessing and grab the latest CPI report here for free before anyone else.