What Is Paid User Acquisition?
With millions of mobile apps competing across stores, organic reach and App Store Optimization (ASO) are rarely enough to scale predictably. This is when Paid User Acquisition (Paid UA) enters the picture.
Paid UA means paying marketing platforms to show your app to specific audiences and generate downloads or in-app actions. It differs fundamentally from brand sponsorship, PR, or influencer deals. Running these campaigns requires a clear understanding of your overall UA costs across various execution models, from self-serve platforms to fully-managed partners or dedicated agencies. Advertisers set their goals and budgets, and UA partners optimize the campaign toward the right target segments based on these specific KPIs.
Unpacking UA Costs: CPI and CPA
Paid UA relies on various pricing models, but advertisers primarily focus on CPI and CPA to manage UA costs and safeguard their budget:
- CPI (Cost Per Install): Advertisers pay strictly when a user downloads and opens the app. It is great for fast scaling.
- CPA (Cost Per Action): Advertisers pay only when a user completes a post-install action, such as creating an account or starting a trial.
However, sometimes tracking CPI alone might be misleading. Acquiring a new user does not automatically bring value or revenue. Advertisers must always compare total ad spend (CPI x new users) against relevant events, such as sign-ups or purchases.
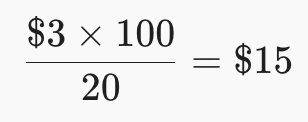
For example, imagine a UA campaign with ($3 CPI and an install-to-sign-up rate of 20%):
- 100 new installs cost $300 ($3 x 100)
- Only 20 users actually sign up.
- Your real cost per sign-up is:
Evaluating these post-install actions gives you the real cost of acquisition, ensuring it never exceeds the user’s Lifetime Value (LTV) and the campaign reaches the desired ROAS.

How Do Paid UA Costs Vary by Channel?
Different paid UA channels rely on different pricing models, and UA costs can vary significantly across networks even when the same model is used:
Walled Gardens:
- Apple Search Ads (ASA): Best for user intent on iOS. Bidding directly on App Store keywords yields high-quality users, though competition often elevates CPMs and CPIs.
- Google App Campaigns (GAC): The primary engine for Android. Automated bidding across Search, Youtube, and Google Play usually offers lower CPIs and broad scale.
- Meta Ads (Facebook & Instagram): Unmatched for behavioural targeting and lookalike modeling once you identify your ideal paying users.
- TikTok Ads: Delivers massive reach and competitive CPMs, but demands a steady flow of native, hook-first video creatives to avoid fatigue.
Beyond Walled Gardens:
- Programmatic Advertising (DSPs): Automated real-time bidding across thousands of independent apps and websites, offering transparent data and flexible pricing models (CPI/CPA) outside closed ecosystems.
- Rewarded Ads (Offerwalls & Rewarded Video): Highly popular in mobile gaming. Users receive in-game rewards (like coins or extra lives) in exchange for installing or engaging with your app, providing high volume at lower CPIs.
- Affiliate Marketing: A performance model where third-party publishers promote your app and earn a commission only when a validated action occurs, keeping financial risk minimal for advertisers.
Comparing UA Costs with Mapendo’s Benchmark Calculator
Evaluating acquisition numbers in isolation makes it hard to know if your UA costs are competitive. Mapendo’s Benchmark Calculator solves this by comparing your internal metrics against current industry performance standards.
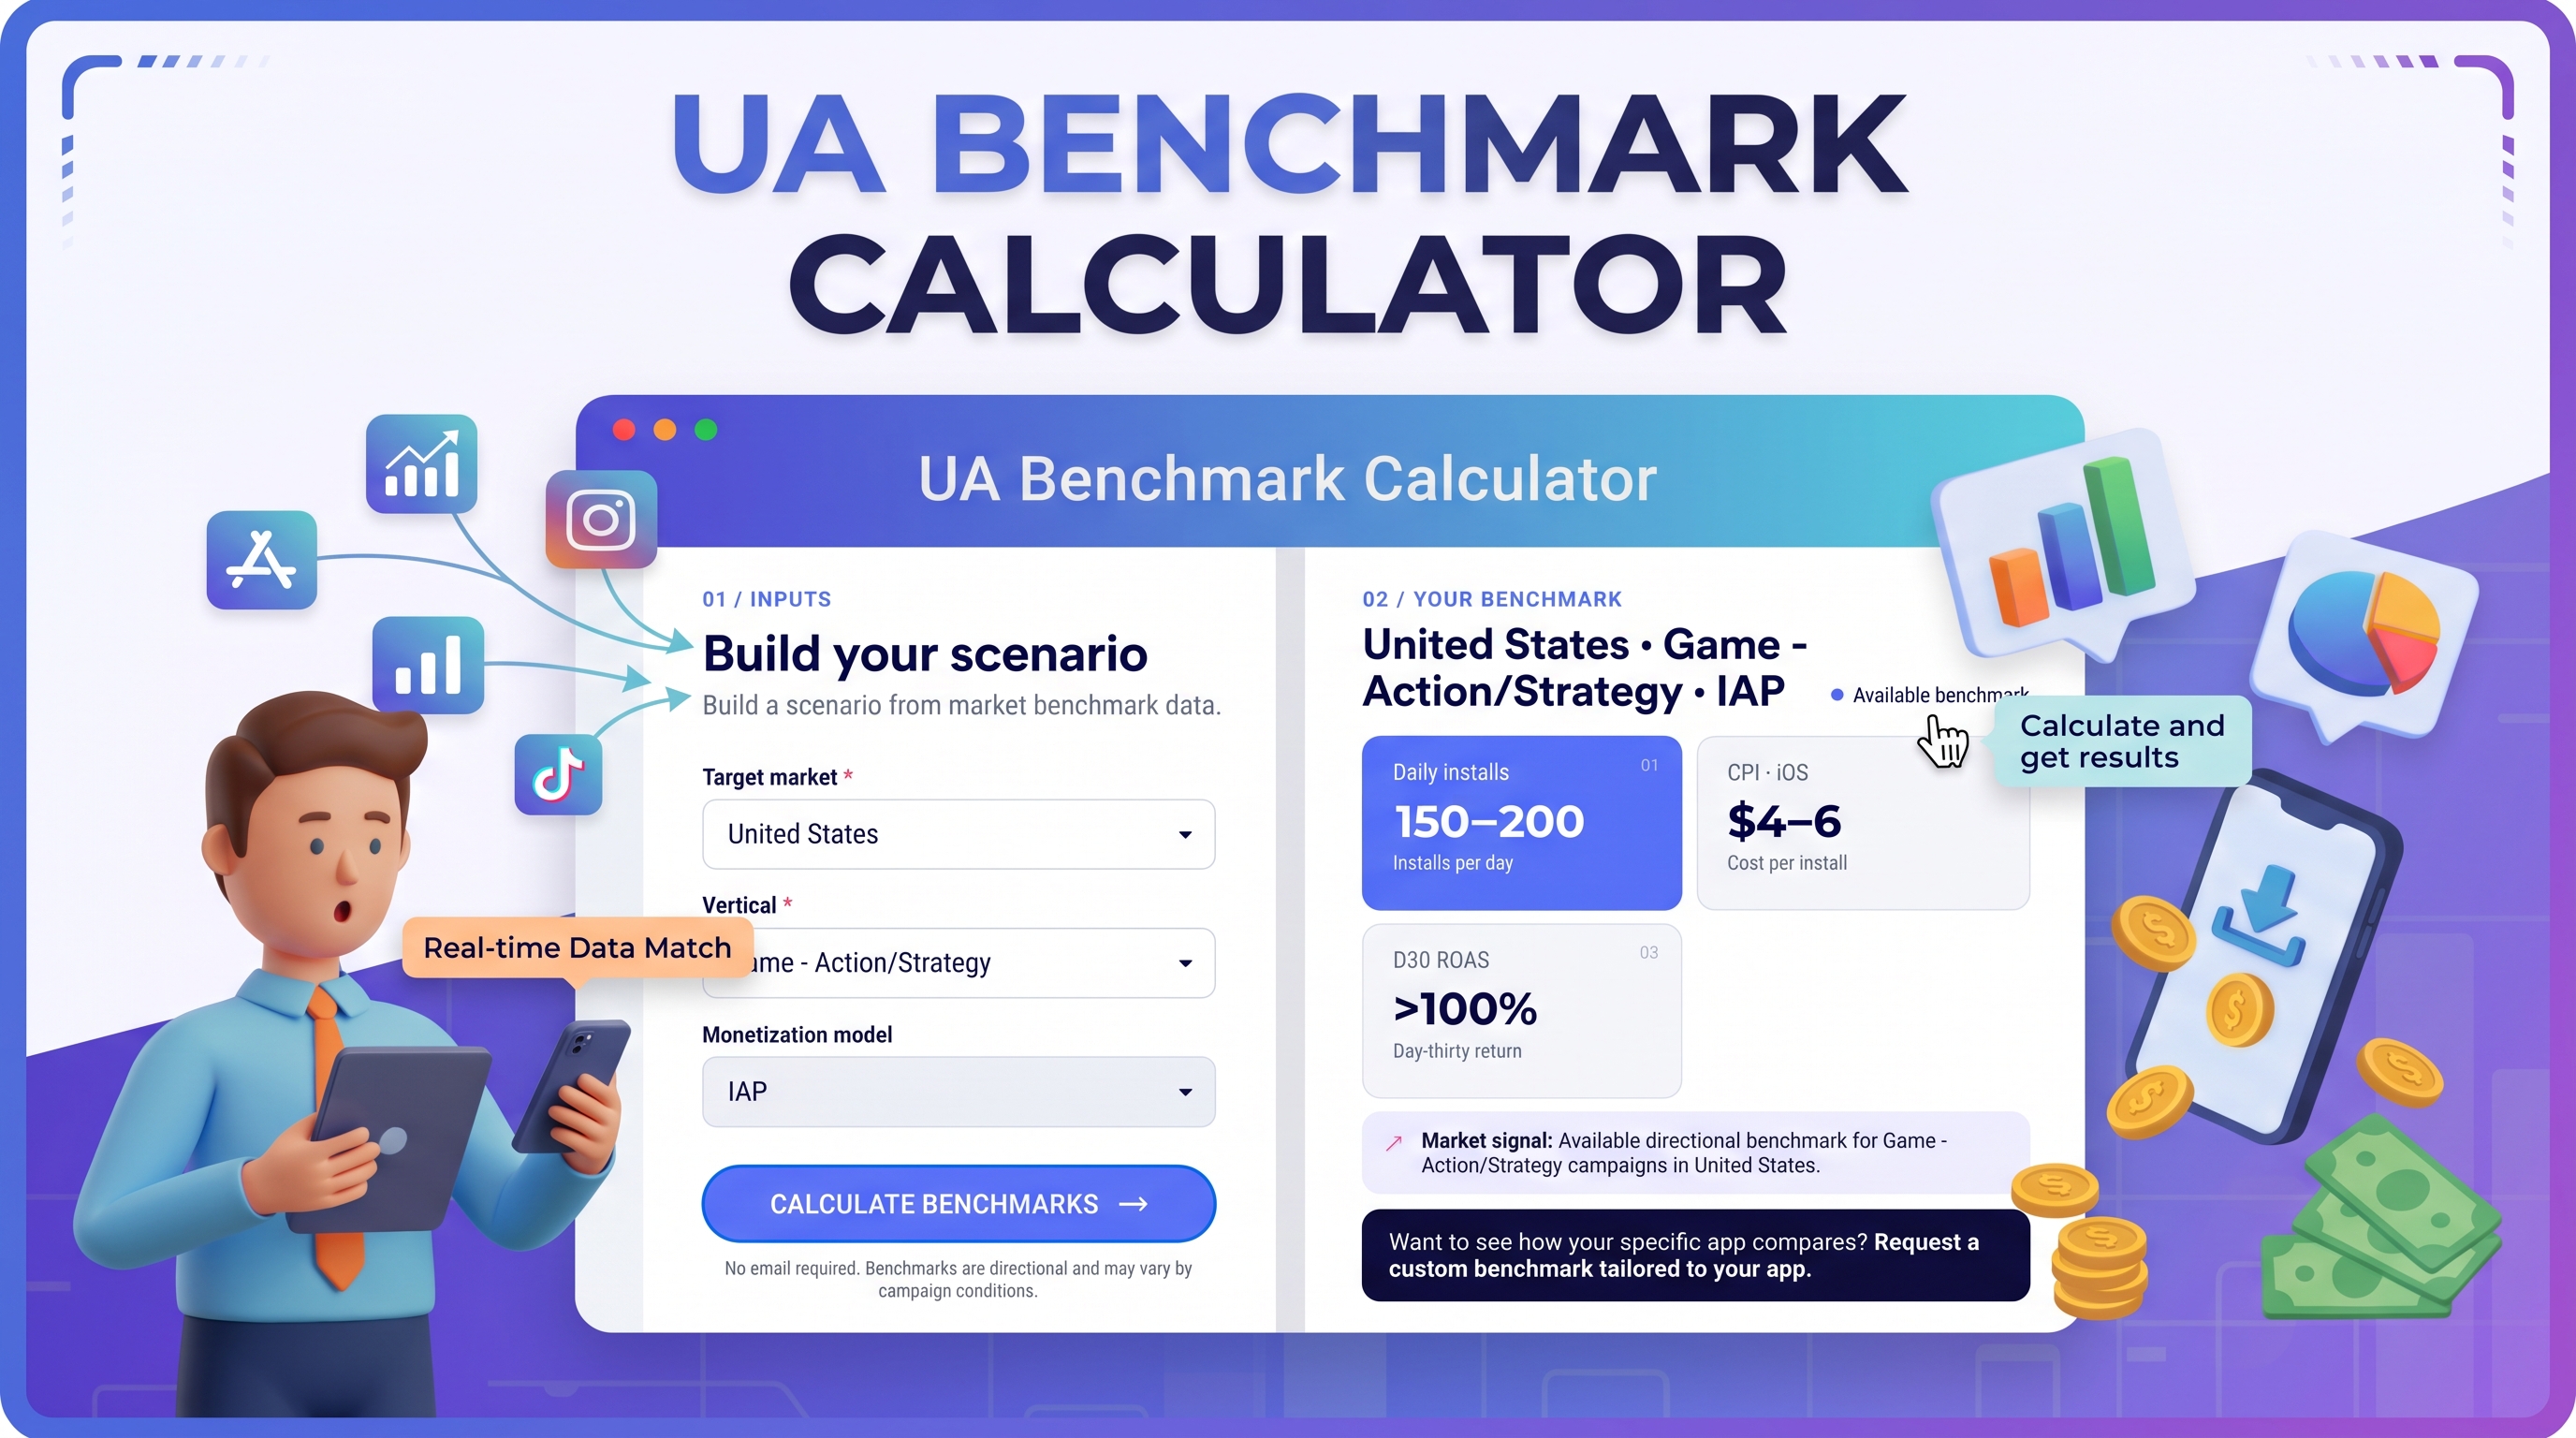
The tool lets you select your target country, app category, and monetization model to see expected ranges for daily scale, unit costs, and returns by working with Mapendo.
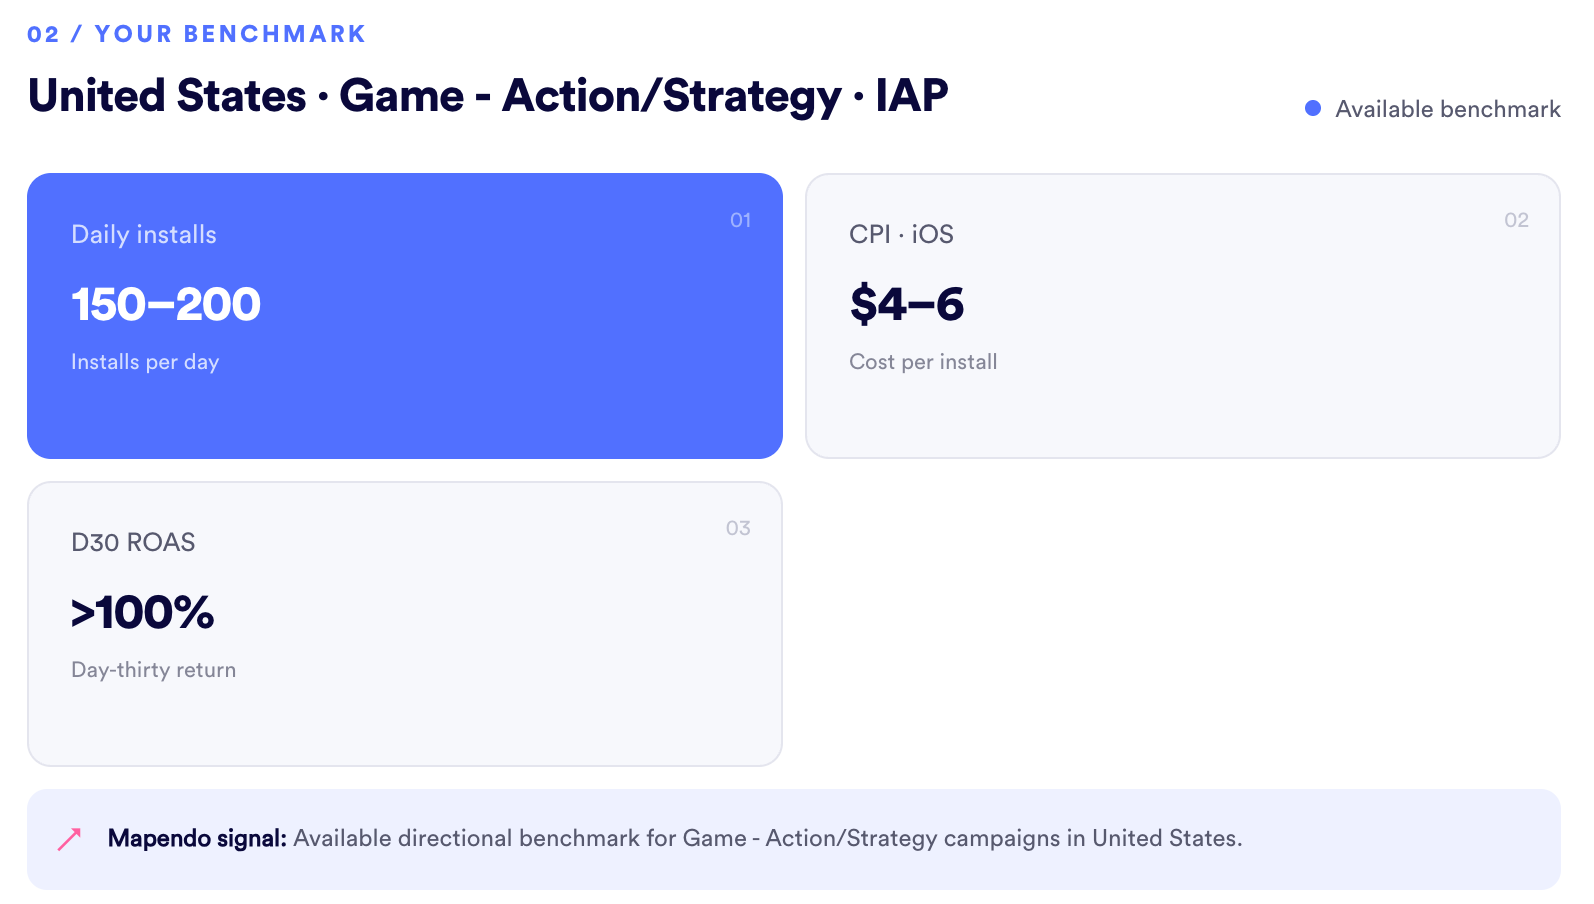
As an example, take an Action/Strategy Game monetized with in-app purchases (IAP) in the United States:
- Daily installs: A typical campaign delivers between 150-200 installs per day.
- CPI on iOS: The industry benchmark sits between $4-6 per install.
- D30 ROAS: At day 30, expected Return on Ad Spend should exceed >100%.
Comparing your performance against these benchmarks gives you actionable clarity. If your iOS CPI is running higher than $6, your ad creatives may be fatiguing or your bidding strategy needs adjustment. Conversely, if your CPI falls within the $4-6 range but your Day-30 ROAS stays well below 100%, your ad setup is healthy, but in-game economy, user retention, or paywalls require immediate attention.
Wrapping up, successful Paid UA is never about chasing the cheapest download; it is about building a profitable, data-backed funnel. By tracking post-install actions, diversifying channels, and regularly evaluating your UA costs against market benchmarks, you can scale your app with confidence and positive ROI.