Every mobile application relies heavily on user acquisition campaigns to reach potential users and to create a sustainable growth path. Attracting new users is in fact the basic factor to boost your company’s revenues and there are several advertising models to achieve those target goals: Cost per Install (CPI) is surely one of the most used.
CPI Formula
With countless apps competing for user attention and spending, the Cost per install performance model is a critical tool for evaluating the efficiency and financial impact of your user acquisition. CPI definition can be summarized as the amount an advertiser pays a publisher each time a user clicks on a paid promotion from their mobile app and installs it. The core behind this key economic index can be expressed by the formula:

Not familiar with CPI metric? Take a look at the explanation we prepared for you: https://mapendo.co/blog/cost-per-install-cpi
This simple metric plays an important role in assessing user acquisition performance, budgeting, and the overall return on our investments. With these basics established, in the next paragraphs we will examine some external aspects that concretely influence the level of cost per install in today's economy.
Factors Affecting CPI
1. Platform - understanding how the choice of mobile platform, iOS or Android, affects acquisition costs through distinct user behaviors and different market dynamics.
2. Apps Categories - variations in installation costs across different app genres, driven by industry competitiveness, user’s features, and monetization potential.
3.Geographic Impact - how different regions' economic dynamics around the world affect CPI.
Platform Based Cost Per Install Differences: iOS vs ANDROID
Analysing the features affecting different levels of prices in user acquisition cost we can’t forget to mention the CPI variation related to the use of the two leading mobile operating systems.
- iOS in this game is definitely the winner of our competition, with the average overall CPI of $4.70 per install. The economic gap between the two leading mobile operating systems can be largely attributed to higher lifetime value of iOS users. Historically, iPhone owners have always had the propensity to spend more on Apple products, which translates into more valuable in-app purchasing behaviour. As a result, advertisers are strongly incentivized to invest more in acquiring IOS users, who tend to engage more with premium services and who are characterised by a greater spending power- that’s what drives CPI for iOS upward.
- Android with a generally lower average CPI of $3.70 per install, allows advertisers to attract a larger user base at a more affordable acquisition cost. Another important consideration is that Android's global reach and larger user database can lead to higher competition in some specific regions, especially in emerging markets areas.

Vertical Industry Analysis: App Categories
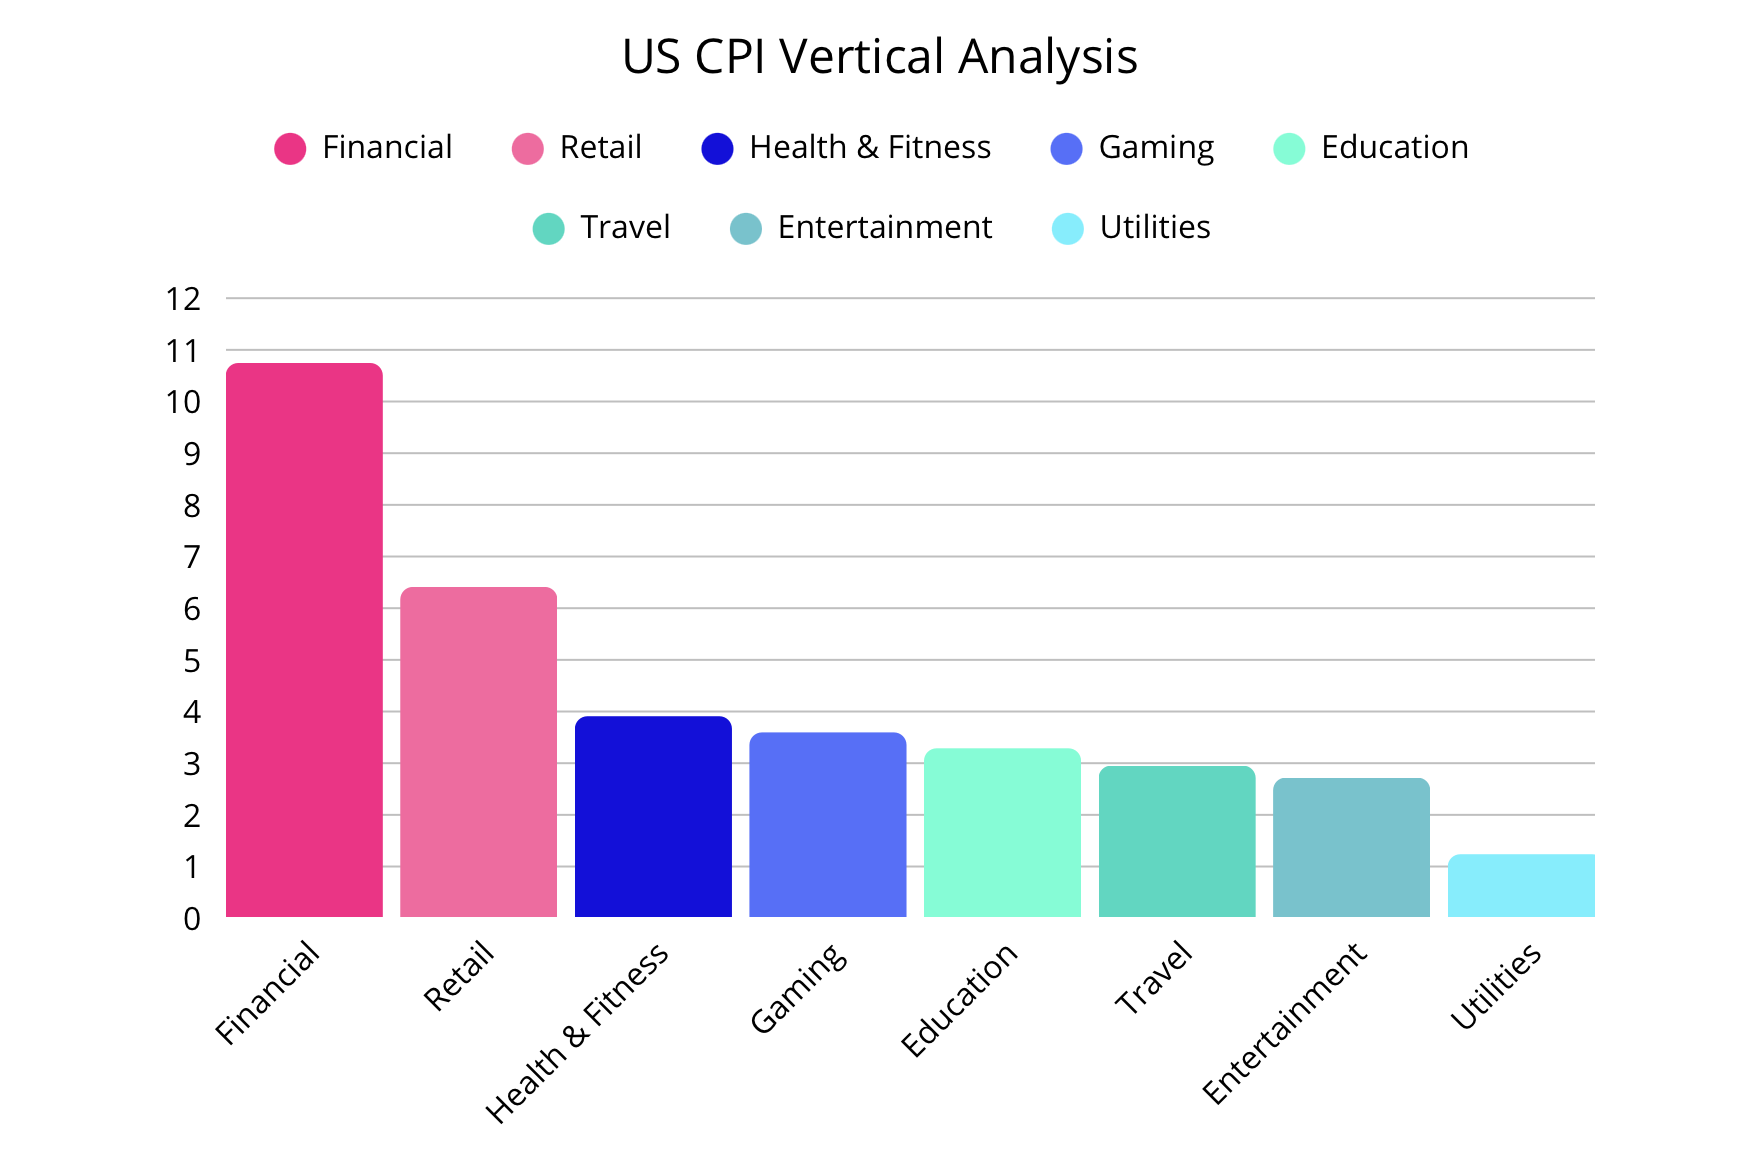
Cost per Install advertising model is applicable to various app verticals and for each of them the price level will be slightly differentiated. In this report we will focus on 8 main app categories to provide a precise and detailed economic analysis.
- FINANCIAL - Apps focused on banking, personal finance, investing, trading, payments, and fintech services. This category typically shows the highest CPI levels, driven by strict security requirements, high-value user profiles and strong competition especially.
- RETAIL - E-commerce and shopping apps for both online and physical stores, including marketplaces, fashion, grocery, and special deals. CPI level across this category is generally high on average, and it surely increases sharply during sales or holiday seasons.
- HEALTH AND FITNESS - category related to physical health, mental wellbeing, workouts, nutrition tracking, meditation, and lifestyle improvements. These apps experience elevated CPI particularly for products offering personalized plan or premium services. Seasonality, such as New Year peaks, surely influence users behaviour and consequently acquisition costs across this app's verticals.
- GAMING - Apps designed for casual, mid-core, or hardcore gameplay experiences ranging from strategy to action, puzzle, and role-playing games. Gaming, being one of the most saturated and performance-driven verticals, shows highly volatile CPI values: casual games may achieve lower costs, while mid-core and strategy titles often face significantly higher acquisition prices due to fierce bidding and higher lifetime value targets.
- EDUCATION - platforms designed for learning, skill development, language acquisition, tutoring, or exam preparation and mainly targeted at children, students, or professionals. Education apps tend to exhibit comparatively stable CPI, though prices rise during peak academic seasons or when targeted professional segments require specific learning tools.
- TRAVEL - related to the service of booking flights, hotels, transportation, trip planning, and local guides. These apps often see seasonal spikes in usage and CPI due to travel demand fluctuations.
- ENTERTAINMENT- Apps for streaming music, videos, movies, games, or general time-off activities. Entertainment apps usually maintain moderate CPI, guided by strong engagement patterns and the presence of subscription-based models, but they can see fluctuations depending on content trends.
- UTILITIES - Apps that provide tools and services for daily tasks, such as productivity, security, file management, device optimization, or system utilities. They often have lower CPI due to broad appeal and lower monetization per user.
To illustrate variations in Cost Per Install across different app categories, we conducted a vertical analysis using as a reference benchmark the most powerful economic reality talking about digital marketing: the US market.
Geographic Impact On Cost per Install
To conduct a precise economic analysis on how geographical factors impact the overall level of costs per installation, we will use this accurate data sheet based on information collected in 8 main areas of interest:
- United States: The traffic in this country is overall expensive, because the monetization potential is higher too.The majority of payoff is related to smart optimization that makes user acquisition cost-effective despite high baseline level of prices and for this reason, advertisers will be disposed to pay more, forecasting higher future revenues. The high variance by vertical in this area is another key feature to highlight, CPI levels in fact change a lot across different categories.
- TIER 1 West, composed of Canada, France, Germany and UK, this group of countries represent a cheaper area under Cost per Install point of view and that’s what makes it the strongest region for conduction an economy of scale, exponentially increasing the number of app’s users.
- TIER 1 East, which includes Korea and India, is a location where gaming and travel apps perform exceptionally well, thanks to the combination premium audience quality and to the high cost efficiency offered by this geographical area. Additionally the high engagement level and the solid retention rate are surely two main other reasons to keep in mind, evaluating this place for profitable advertisement campaigns. Finally, those two countries are grouped together also because they offer the opportunity to scale without the expensive U.S. level of CPI.
- TIER 2 West composed of Australia, Mexico, Brazil, Spain, Italy, Netherlands, Poland, can absolutely be defined as a geographical region very good to achieve volume scaling goals. It is also worth to specify that while you may get a lot of installs, the average revenue generated per user tends to be lower compared with premium or high-LTV markets: if one one side you’ll have a high number of users from the other one you’ll have potentially low monetization for each of them. Notable, in this area, to highlight the strong performance related to Utilities and Gaming app categories.
- TIER 2 East, comprehending the country of Taiwan, Indonesia,Turkey, Thailand and Philippines, those regions offers the possibility of gaining massive install volume at highly affordable Cost Per Installations. As every cheap- high volume area, those places are very useful for advertisers in the early stage of the marketing process when it is crucial to achieve a broader audience, helpful also to improve specific users targeting. This place can be defined as the best for Utilities and Casual Gaming.
- Rest of the world: All these countries have a moderate level of CPIs, surely cheaper compared to the ones we talked about before. Although the price is lower, the quality of users is questionable too, in fact those spots are all characterized by low level of ROAS: concretely the advertiser will have lower cost per install but they will also gain fewer revenues for each dollar expenditure. This, consequently makes investing in those countries surely less safer than buying some more expensive installations elsewhere. On the other hand, this region offers a strong advantage for testing targeting strategies as well as optimizing app features. These markets are especially suited for low-cost content and utility-focused applications.
- Japan: It surely represents another high precision market, able to attract the right Lifetime Value audience. The above average Cost of Install related to this country makes it an expensive high-intent user market, economic characteristics that can be easily associated with the US market. However when we talk about Japan CPI related cost the slight difference is that in this country the quality is prioritized over the user's scale. The targeting and the audience segmentation combined with the right advertisement localization in this country are the keys to have high returns on Cost Per Install investment. Last but not least, Japan is a profitable market especially for Gaming and Finance app.
- China: It offers a massive user base, one of the largest in the world and this becomes a huge potential for advertisers as in this geographical market they can potentially catch millions of users. We must say that even if it is effective to gain a higher quantity of users in this country, it is also a bit more complex because of China's fragmented ecosystem. The advertisement environment in fact, is divided among many different app stores, ad networks and platforms (e.g., Tencent, Baidu, Xiaomi, Huawei, etc.) instead of being centralized like the US with Google Play and Apple Store, consequently leading to higher operational complexity. This area is still very profitable for Gaming, Entertainment and Utilities.
Final Insights
Our analysis showed that CPI is influenced by multiple factors each of which plays a significant role in shaping the cost and efficiency of marketing campaigns.
In conclusion, mastering CPI across platforms, categories, and geographical areas allows advertisers to make informed decisions, optimize campaigns, and achieve a sustainable balance between user acquisition costs and revenue potential. By understanding these dynamics, businesses can strategically allocate budgets, drive growth, and maximize ROI in a competitive global app market.